
For Databricks data engineers
buildfrm is an AI tool that lives where your team already works. During development, it ships pipelines from a spec across VS Code and Browser Extension on Databricks UI, with the same context flowing through both. After deployment, it stays attached monitoring runs, reading the team's Slack thread, proposing fixes when things fail, and keeping every architectural decision searchable for the next change.
The fix discussed at standup becomes the change applied to the pipeline. The diagram in last quarter's spec is still searchable today. The pipeline that paged you at 3am is already healing itself by the time you open your laptop.
Databricks-native
Snowflake · dbt · Airflow · Dagster — coming.
Data engineers don't live in one tool. buildfrm shows up in places where most of the day happens.
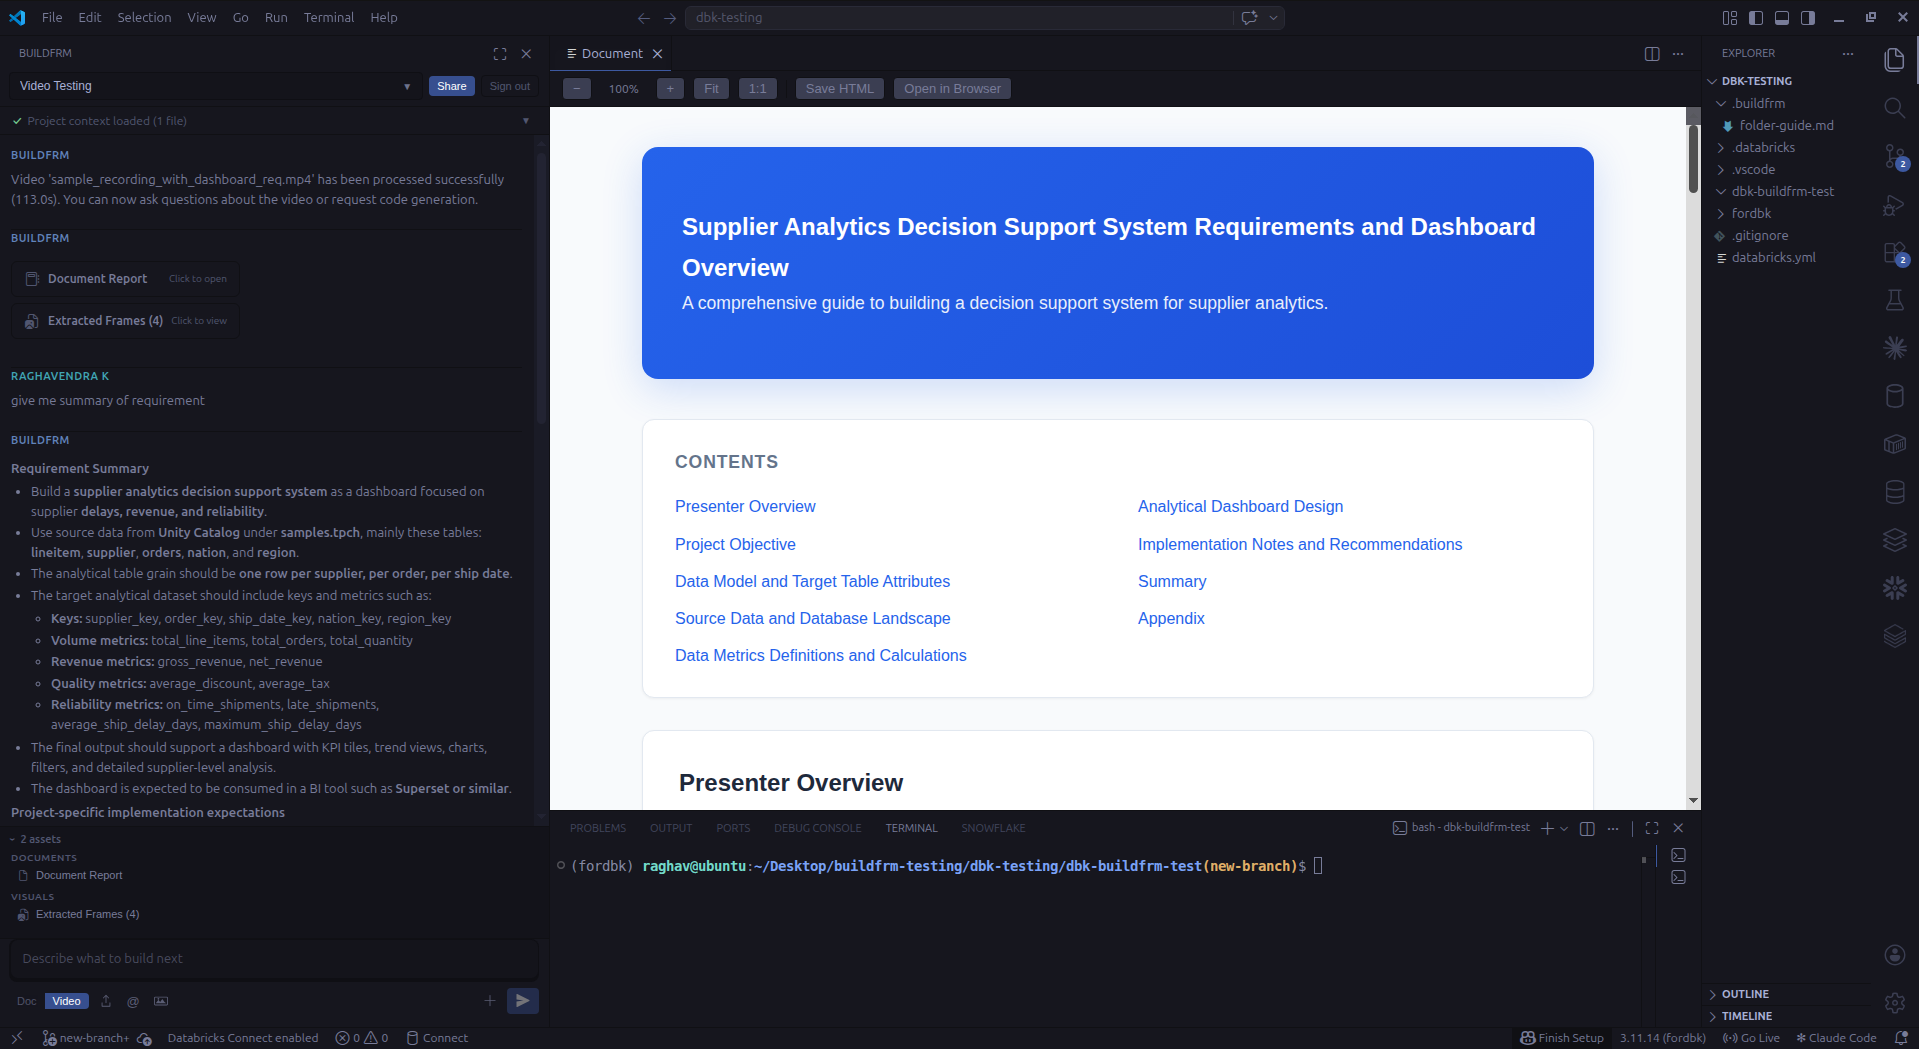
VS Code extension
Activity-bar panel, Google sign-in, inline fixes, writes generated files into your repo. Streams responses while it works.
Chrome extension
Side panel on *.cloud.databricks.com and Azure Databricks. Injects code cells straight into the notebook you're looking at.
@dlt.table cells injected into the active notebook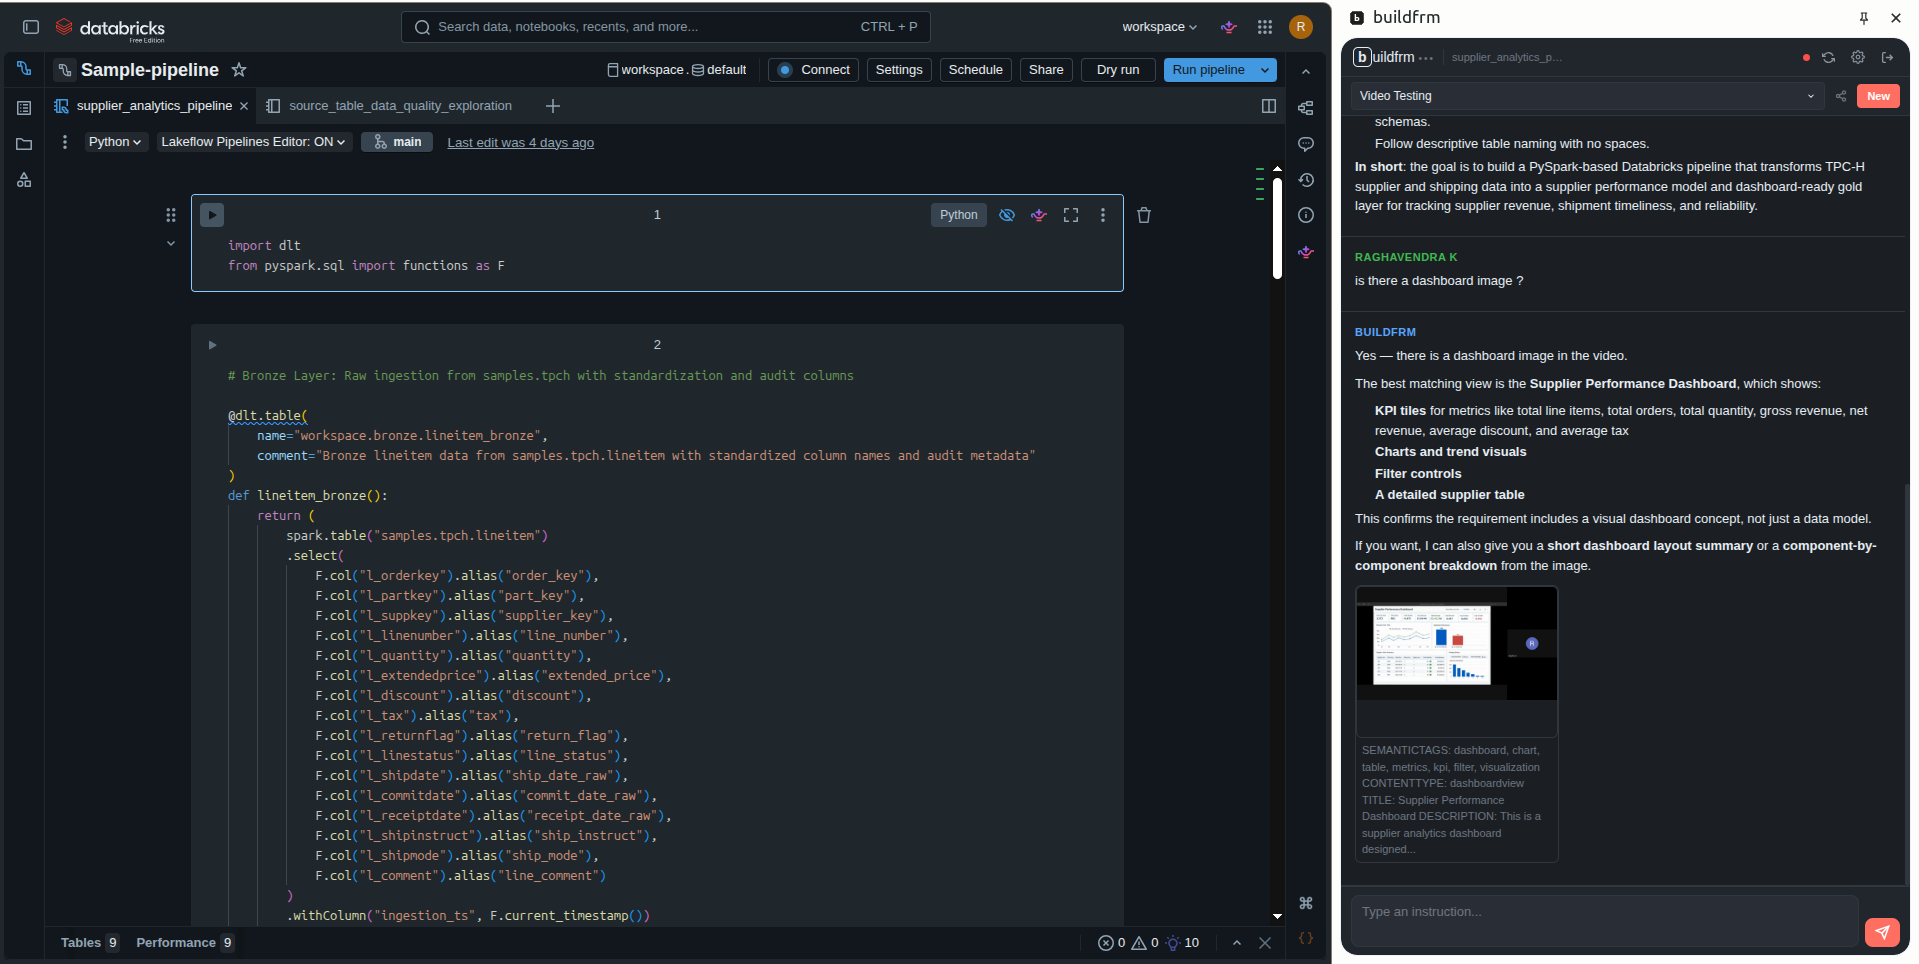
The shapes of input we see most. Drop the real thing and get running code — not a suggestion, not a snippet to paste somewhere else.
import dlt
from pyspark.sql.functions import col

@dlt.table(
  name="orders_silver",
  partition_cols=["region"],
  comment="Deduped orders joined to customer dim, daily grain",
)
def orders_silver():
    orders = (
        dlt.read("orders_bronze")
           .dropDuplicates(["order_id"])
    )
    customers = spark.read.table("main.sales.dim_customer")
    return orders.join(customers, "customer_id", "left")
{{ config(materialized='incremental', unique_key='customer_id') }}

with orders as (
  select * from {{ ref('stg_orders') }}
  {% if is_incremental() %}
    where order_ts > (select max(last_order_ts) from {{ this }})
  {% endif %}
),
customers as (
  select * from {{ ref('dim_customer') }}
)
select
  c.customer_id,
  sum(o.gross_amount)       as lifetime_value,
  count(distinct o.order_id) as order_count,
  max(o.order_ts)           as last_order_ts
from customers c
left join orders o using (customer_id)
group by 1
from snowflake.snowpark.functions import col, sum_, avg, count_distinct

def supplier_kpis(session, region: str | None = None):
    df = session.table("sales.fact_shipment")
    if region:
        df = df.filter(col("region") == region)
    return df.agg(
        sum_("line_total").alias("gross_revenue"),
        avg("discount").alias("avg_discount"),
        count_distinct("supplier_id").alias("suppliers"),
    )

def on_time_trend(session):
    return (
        session.table("sales.fact_shipment")
               .select("ship_date", "is_on_time")
               .group_by("ship_date")
               .agg(avg(col("is_on_time").cast("int")).alias("rate"))
    )
sales_medallion/
├── ingestion/
│   ├── postgres_to_bronze.py     # JDBC + incremental
│   └── jdbc_config.yml
├── bronze/
│   ├── orders.py                 @dlt.table
│   ├── customers.py              @dlt.table
│   └── products.py               @dlt.table
├── silver/
│   ├── orders_cleansed.py        @dlt.table  # dedupe, expectations
│   └── customers_scd2.py         @dlt.table  # SCD type 2
├── gold/
│   ├── revenue_daily.py          @dlt.table  # currency norm + agg
│   └── orders_by_region.py       @dlt.table
├── jobs/
│   └── medallion_pipeline.yml    # Databricks Workflow
└── observability/
    ├── lineage.json              # Unity Catalog
    └── alerts.yml
Mockup. Real examples from your own inputs on the demo call.
Shared sessions
Share a session by email with view or admin access. The next engineer opens the same session, the same chat, the same inputs — and the same decisions your team already made.
Self-hosted
For teamsFor teams that don't want to send data to external applications. Deploy the full stack — inside your VPC.
Custom
For teamsMaybe your org is on AWS, Azure, or GCP — Glue, Synapse, BigQuery, Dataform, or some mix of all three. We can deliver solutions made for your stack, not adapted from someone else's.
Early access For Solo Engineers
Early access For Teams
The bet
At our last data jobs, every new pipeline started the same way: a 45-minute kickoff call, a Confluence page that took two days to write, then four days of someone translating it all into PySpark. By the time the code shipped, half the decisions from the kickoff had been forgotten. Six months later, when something broke at 3am, the on-call engineer had no idea why a column was named the way it was.
AI coding tools have gotten very good at the file in front of you. None of them remember the kickoff call from last quarter. None of them know what your team decided in Slack on Monday. None of them carry context across the editor, the notebook, and the next engineer who opens the same pipeline. For most software work, that's fine. For data engineering, that gap is where the bugs live.
buildfrm is our attempt at the AI coding tool data engineers actually need. It lives across the surfaces your team already uses — VS Code, the Databricks UI, eventually a CLI and a Slack bot — and the same context flows through all of them. The kickoff video, the spec doc, the design decisions, the on-call thread: it remembers all of it, and so does the engineer who picks up the work next.
We're early. The product works, but the surface area we want to cover is large. If this matches your problem, the early-access form above is how to start using it now — and how to tell us where we're getting it wrong. Five engineers who push back are worth more to us than fifty who nod.
The ones we hear most.
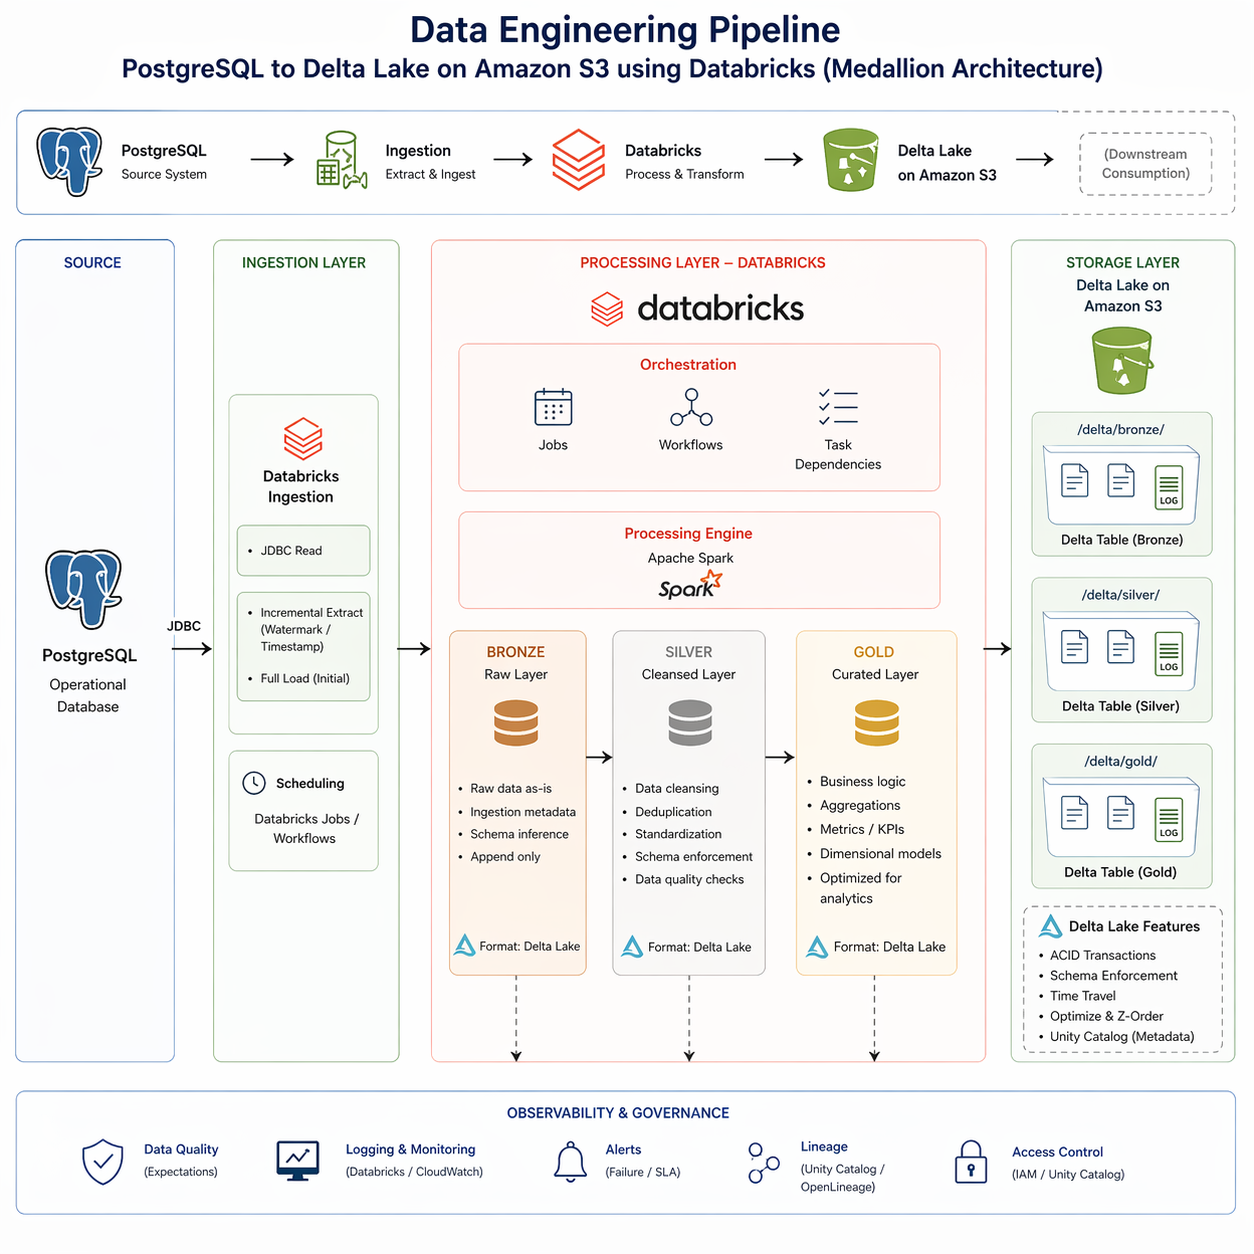
buildfrm reads kickoff recordings, specs, sample data, and architecture diagrams and writes Databricks pipeline code — PySpark, Delta Lake, Delta Live Tables, Unity Catalog three-level namespace — that runs in your workspace. It lives as a VS Code extension and a Chrome side panel on the Databricks UI.
Databricks first: PySpark, Delta Lake, Delta Live Tables (DLT), Unity Catalog, Databricks Workflows, notebooks and jobs. Snowflake, dbt, Airflow, and Dagster support is coming.
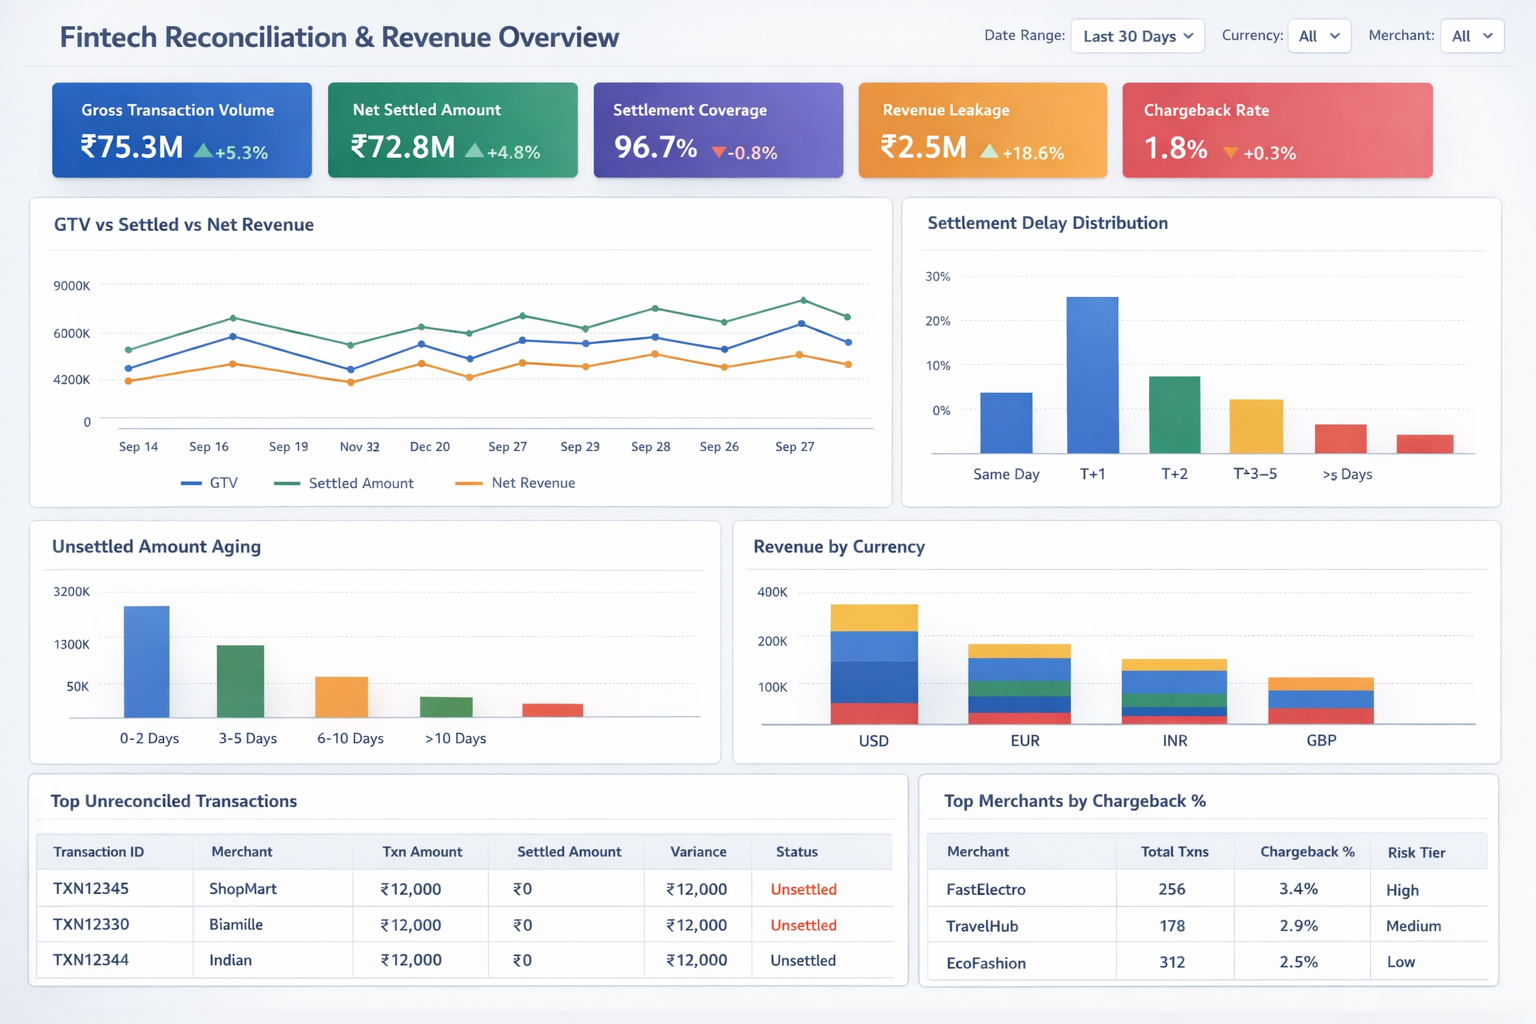
Video and audio recordings (mp4, mov, webm), transcripts, documents (pdf, md, xlsx, csv), data samples (parquet, json, xml, yaml), existing code (.py, .sql, .ipynb, .scala, .r), and images (jpg, png, gif, webp) including dashboard mockups and architecture diagrams.
Yes. The full stack — backend, Postgres, vector store, object store — deploys via Docker Compose inside your VPC. Bring your own LLM keys (Anthropic, OpenAI) or run local via Ollama. Available for teams; contact sales.